Overview
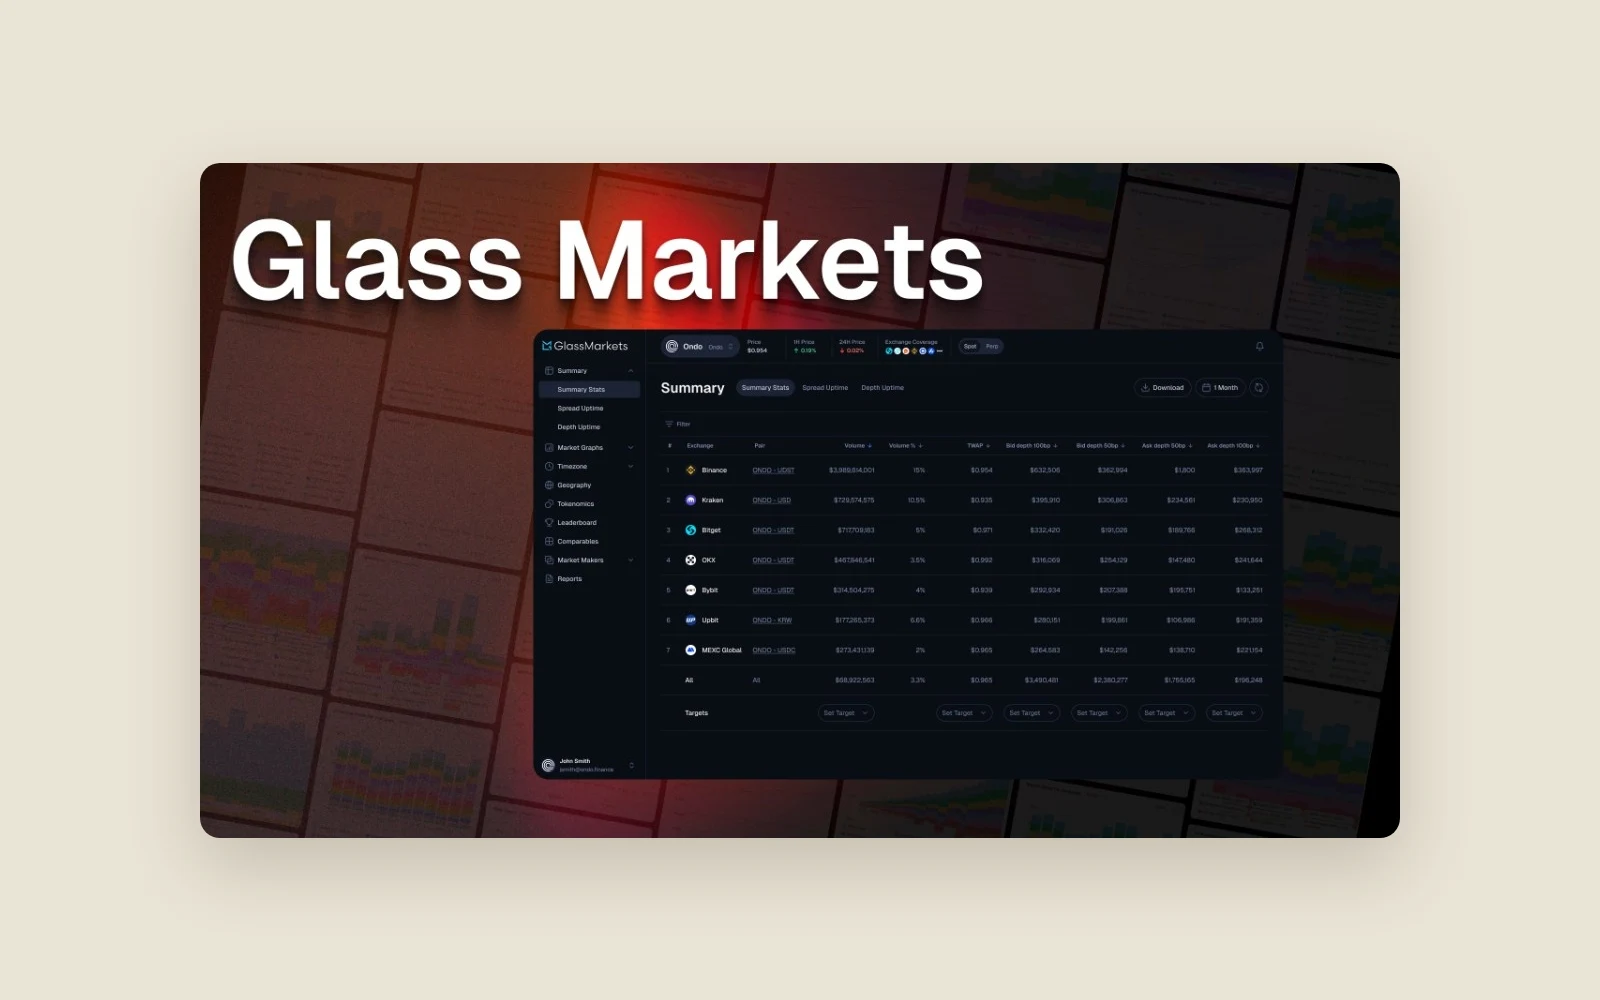
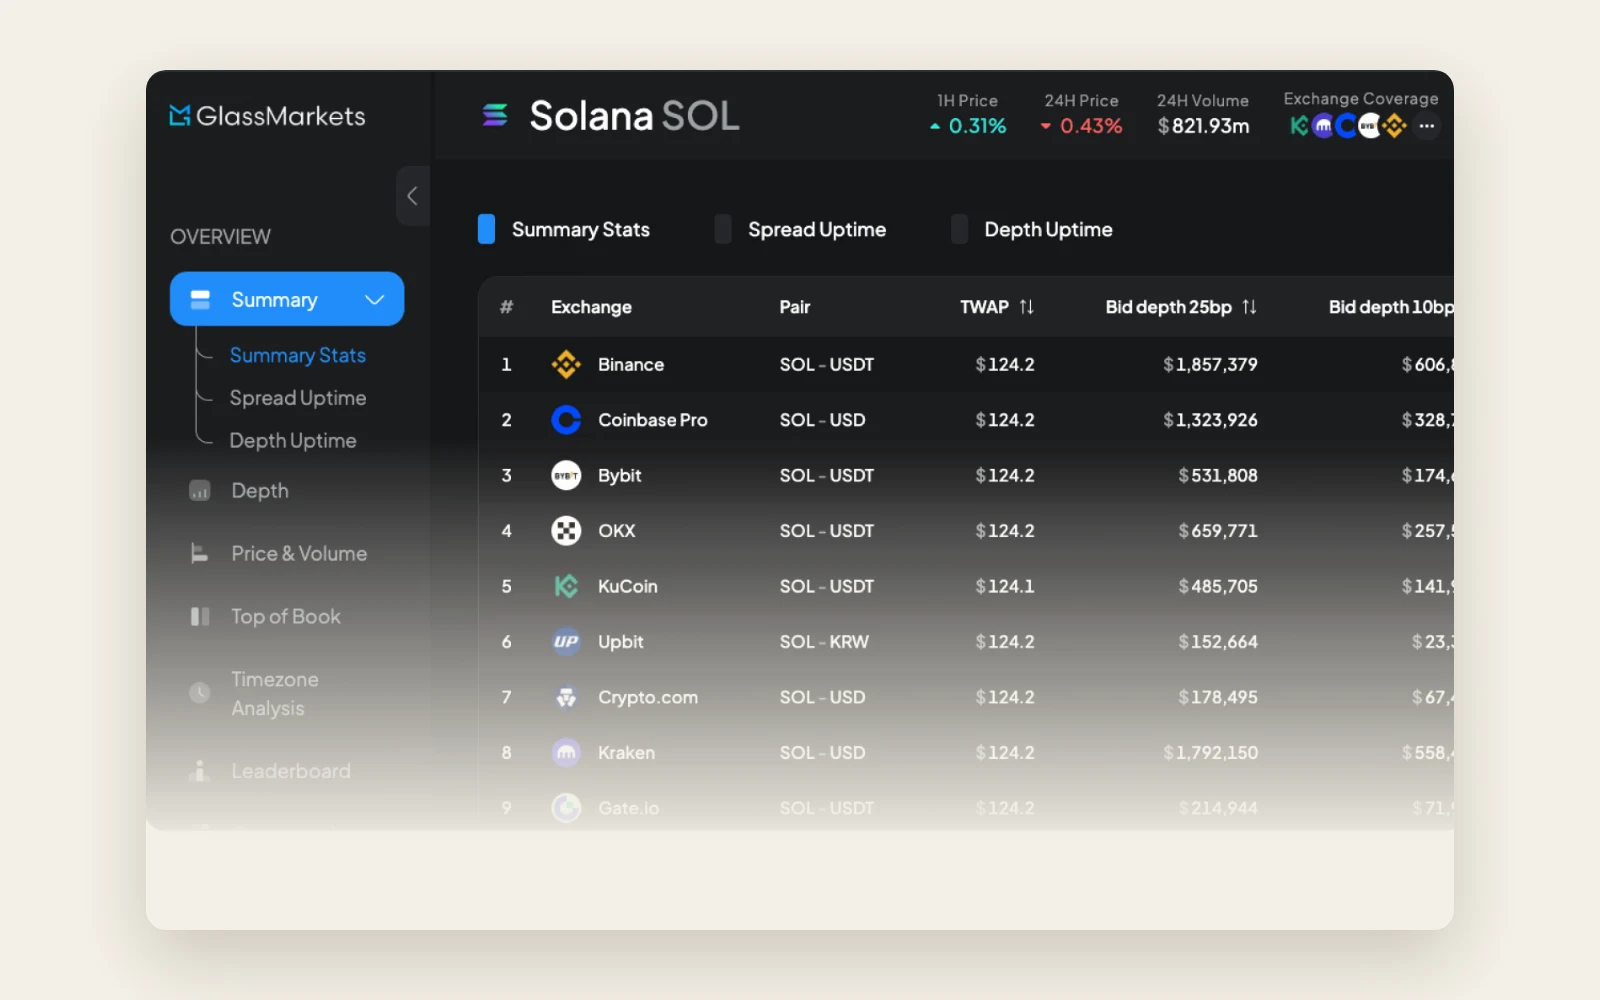
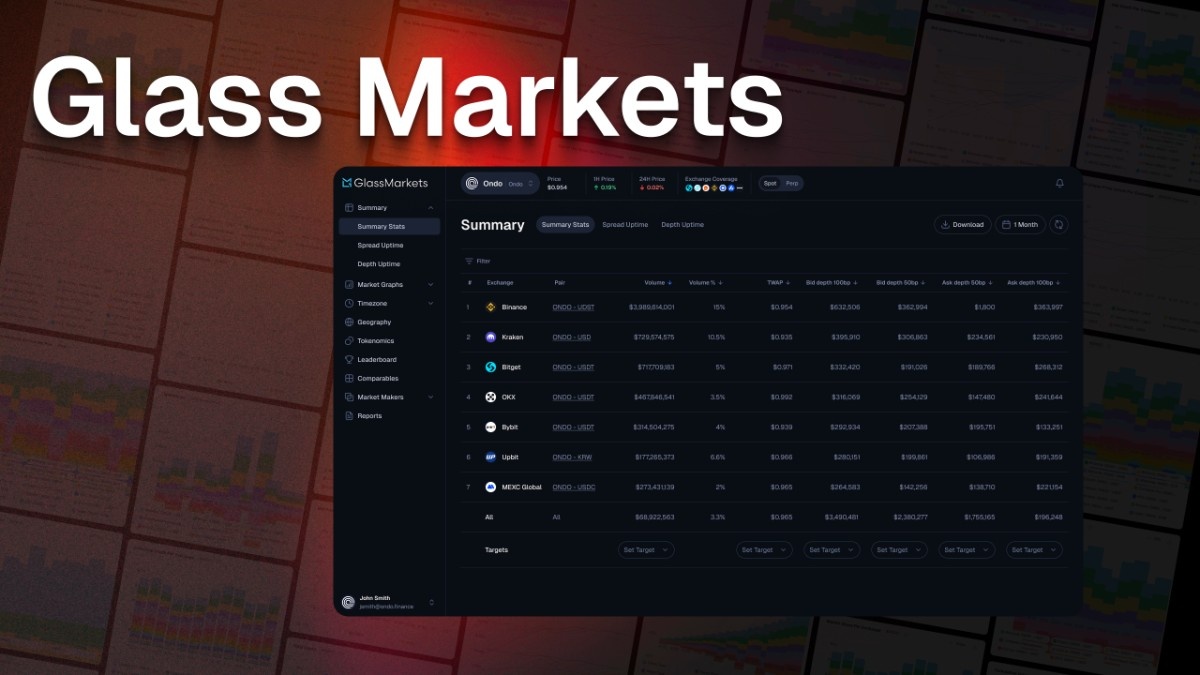
Glass Markets is a market data terminal for digital asset issuers and token foundations. It helps those teams monitor liquidity by comparing prices, trading activity and order book depth across exchanges. The app presents market data in summary tables and charts.
Glass Markets already had a product and an in-house team. Barq joined as additional full-stack engineering capacity. The engagement covered backend analytics, data pipelines, visualisations in the existing app and a landing page.
The problem
The Glass Markets team needed extra engineering capacity to develop its terminal. Token issuers use the terminal to look at a token's price alongside how much is trading and how much liquidity is available in the order book. The in-house team needed help preparing the market data behind those views and adding features that made it easier to inspect.
The challenge
Contributing to an existing product
Glass Markets had already built its analytics platform and had engineers working on it. Barq's work had to fit around the existing product and the specific tasks the client assigned.
Preparing data for comparison
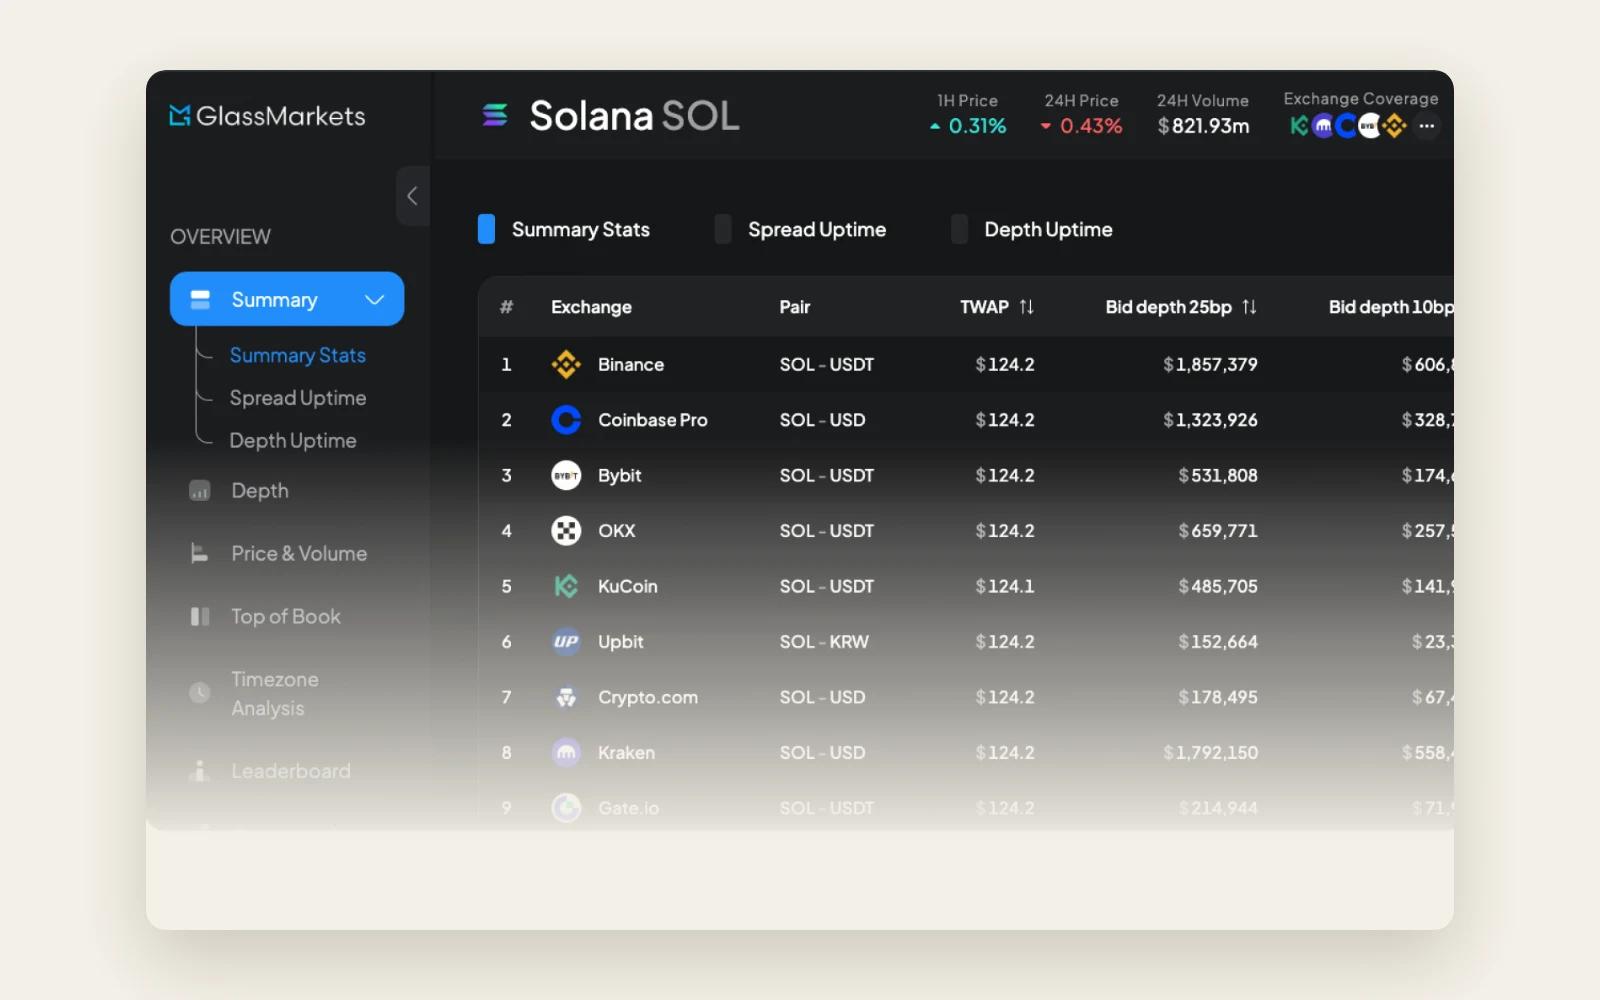
The terminal compares trading pairs and exchanges using measures such as price, volume and depth. The data pipeline had to collect and prepare market records so the analytics app could use them.
How we approached it
Join the product team on specific tasks
Barq took on contracted engineering work alongside the client's developers, with backend and data pipeline tasks forming part of that contribution.
Work on the data and the terminal together
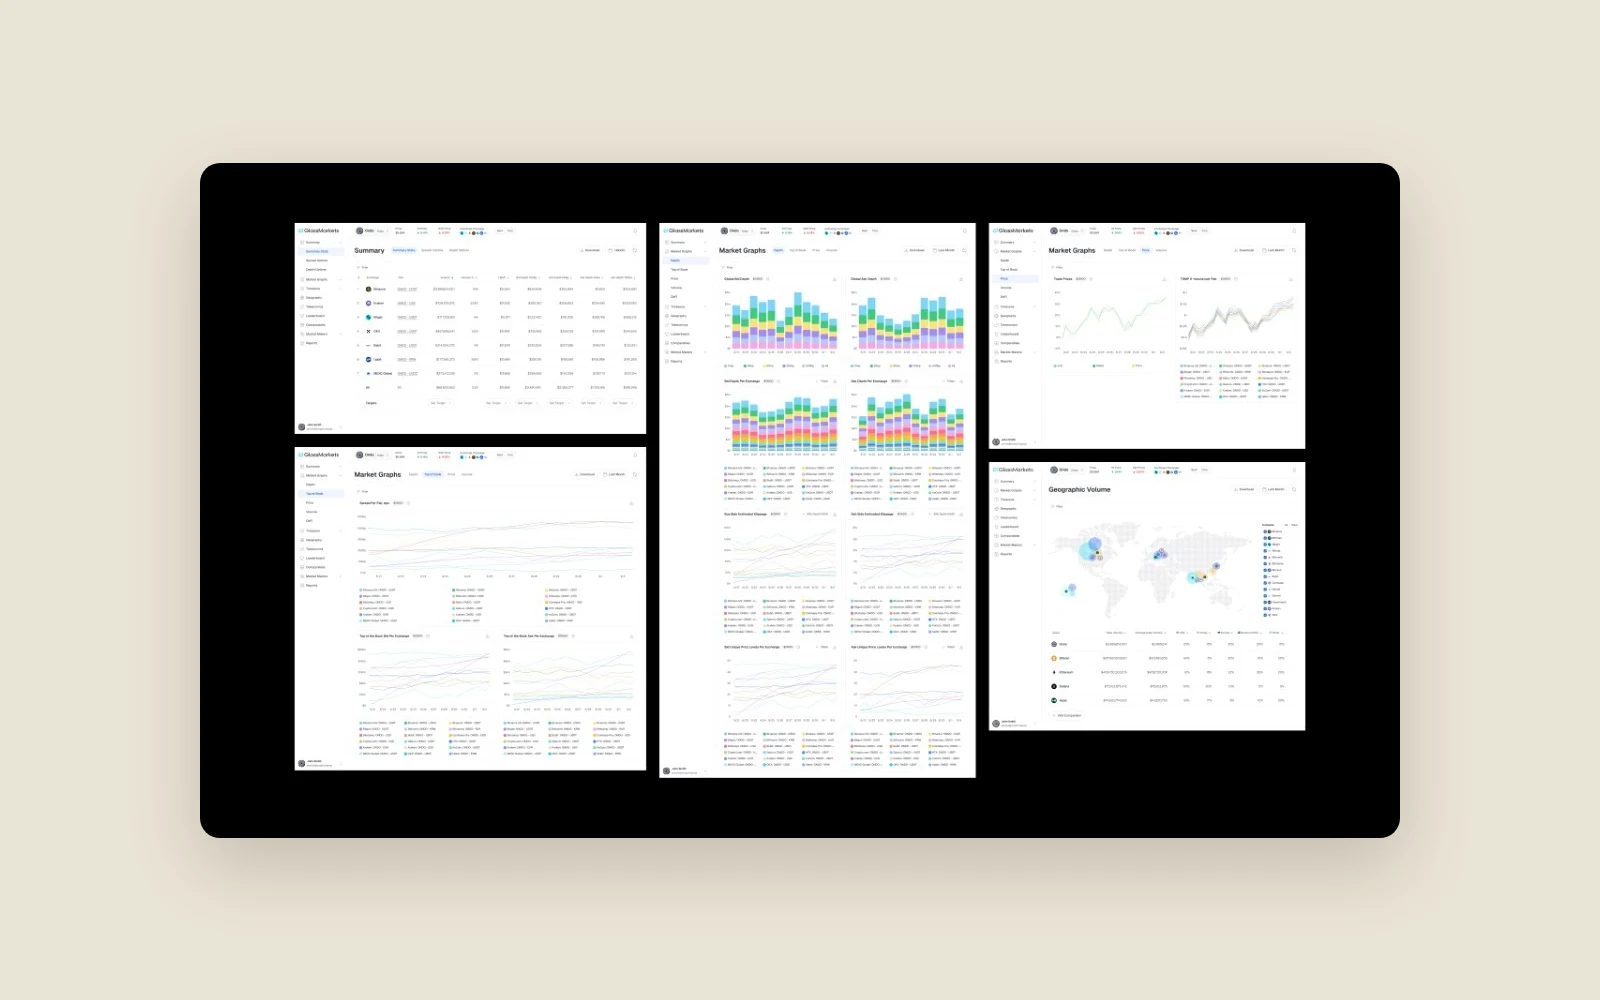
The engagement covered extraction, transformation and loading alongside analytics features. Barq also added visualisations in the app, where users could inspect market figures as tables and charts.
Build a public introduction to the product
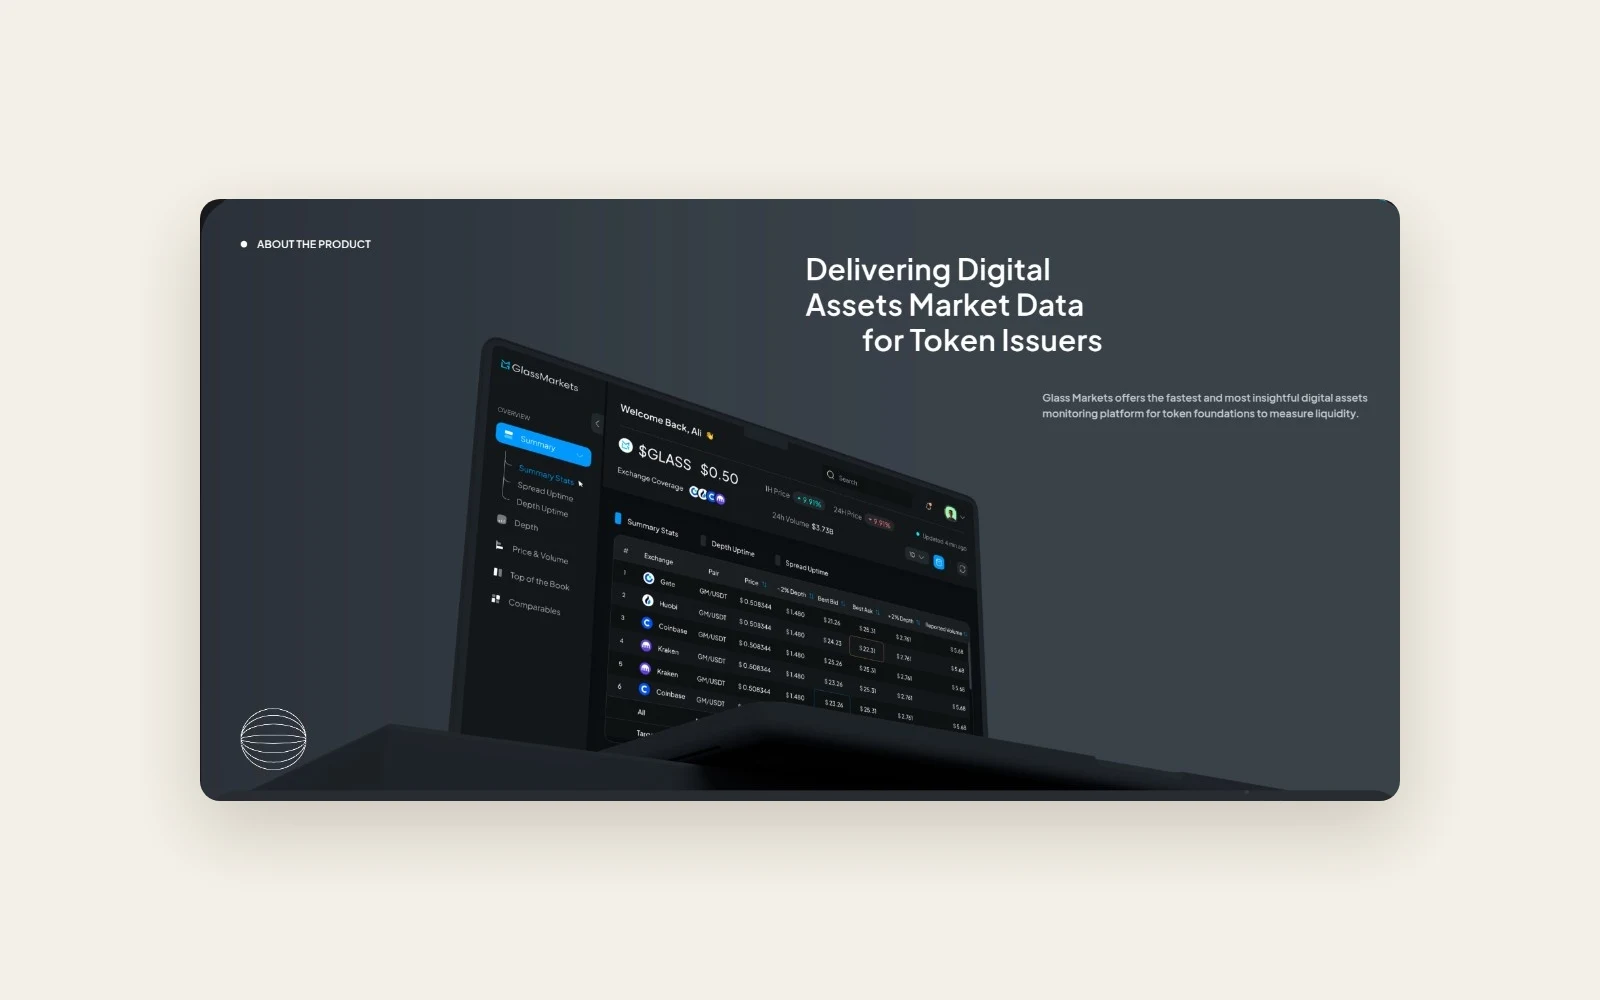
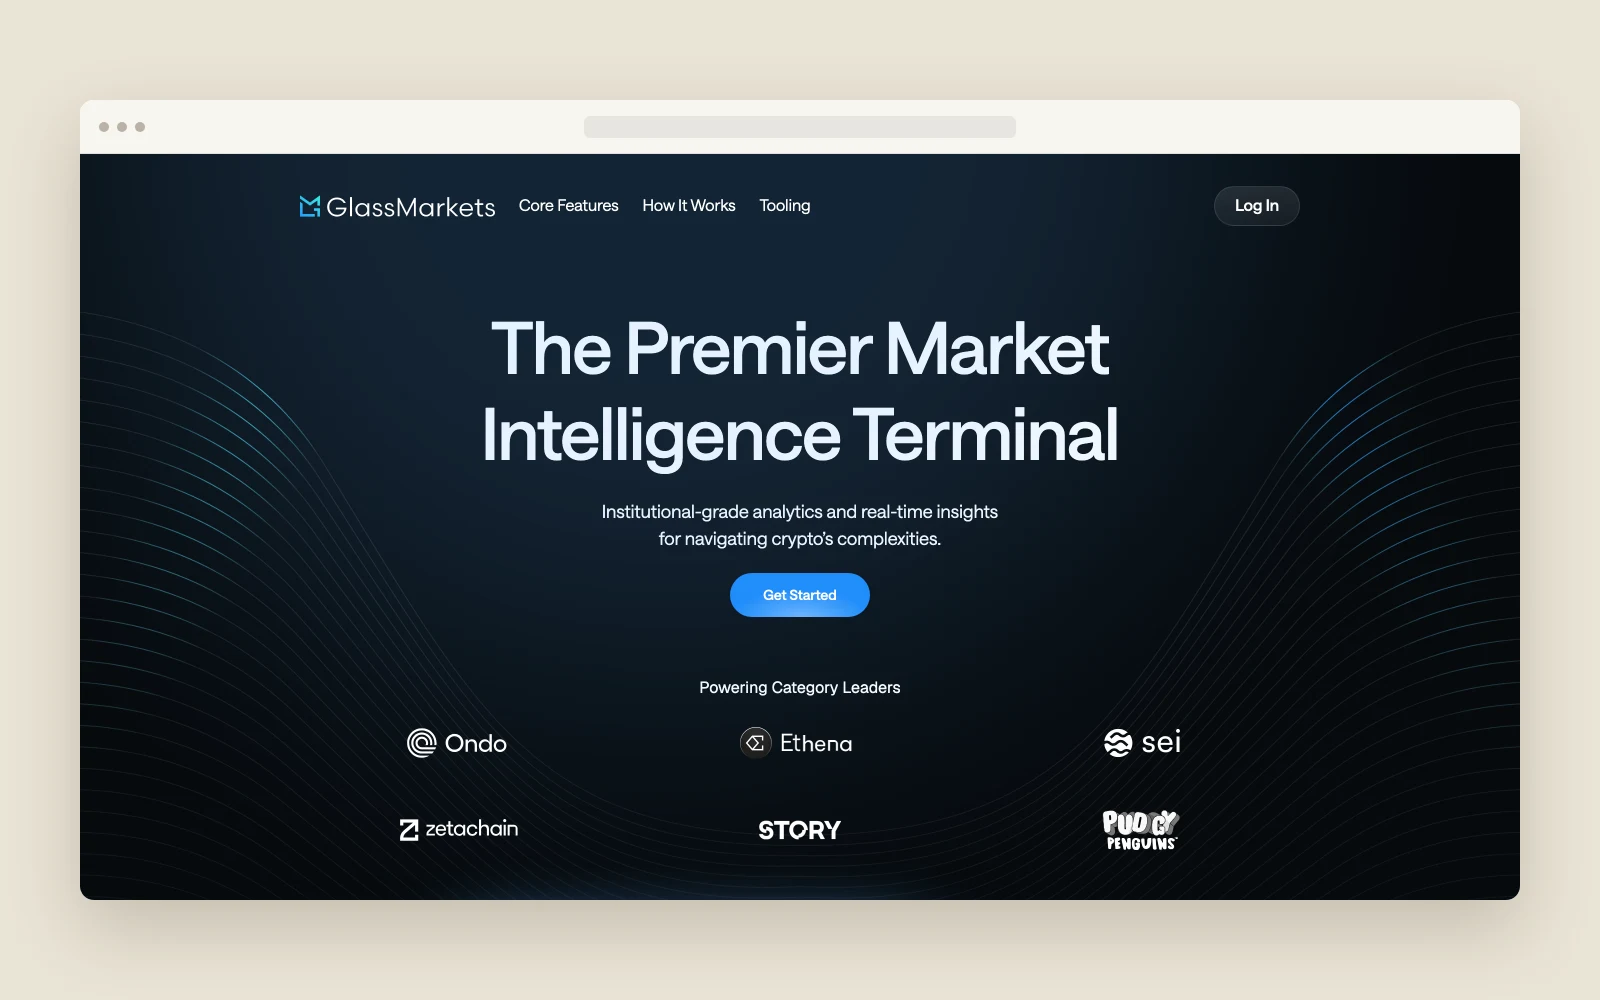
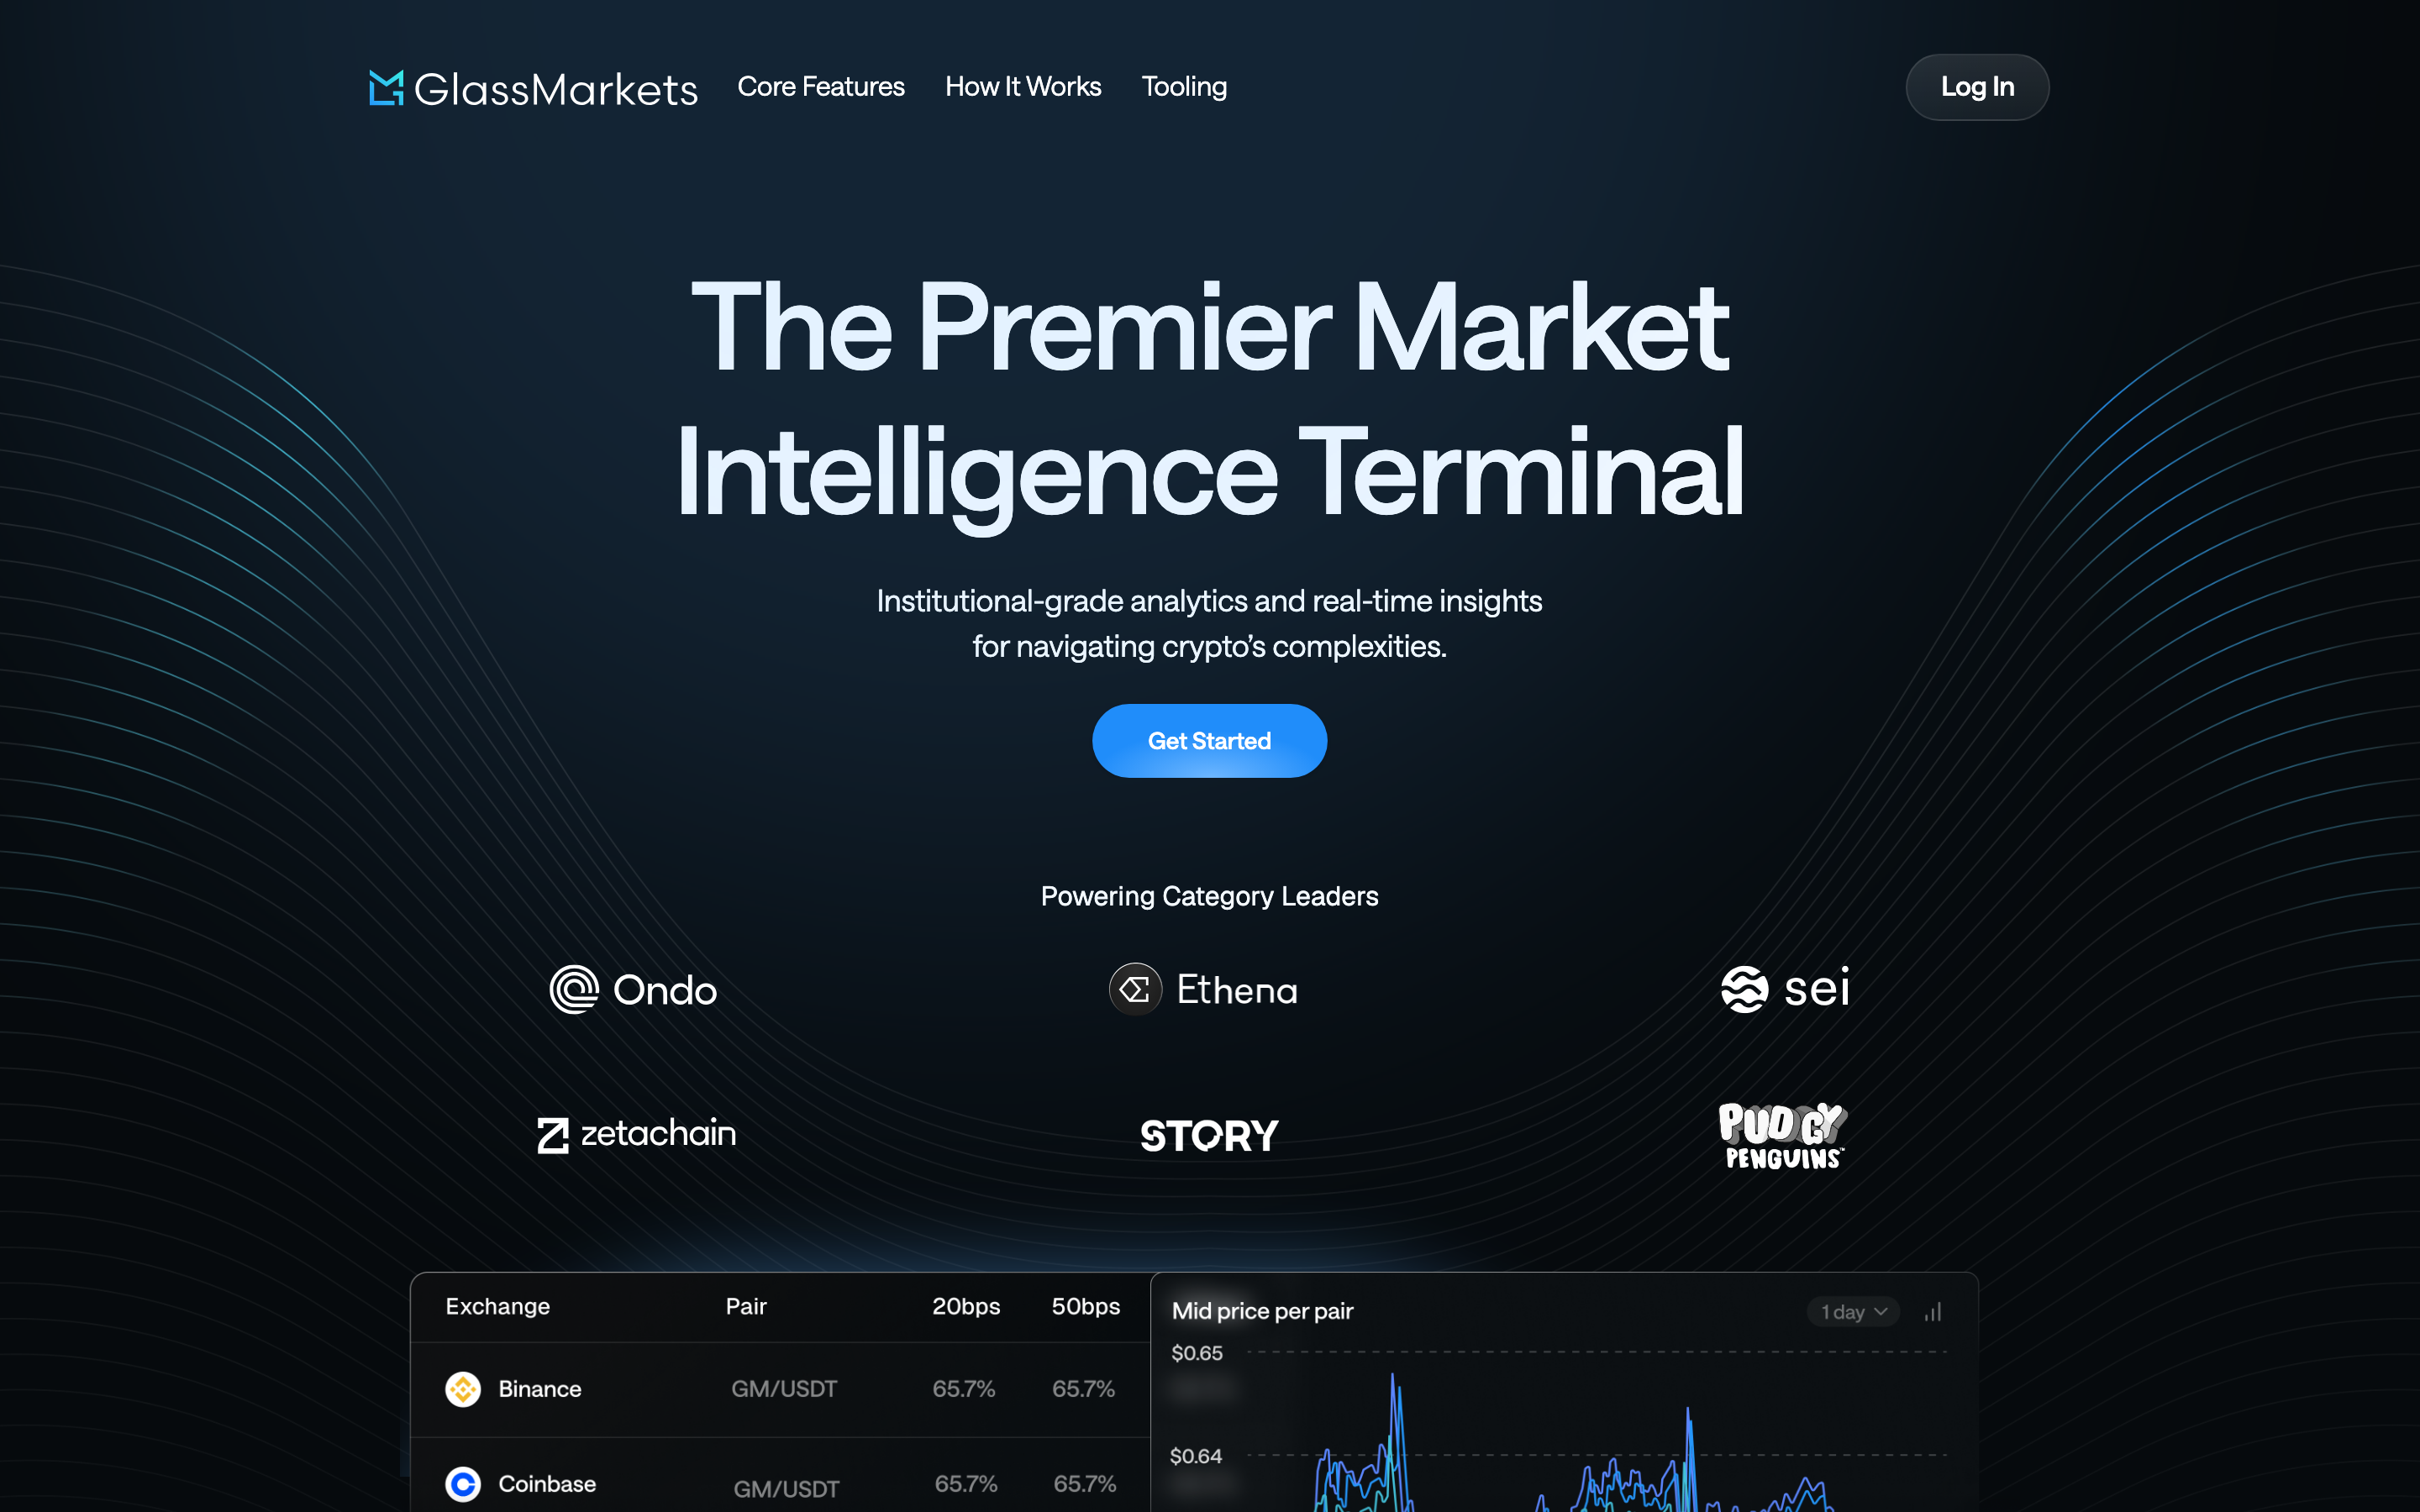
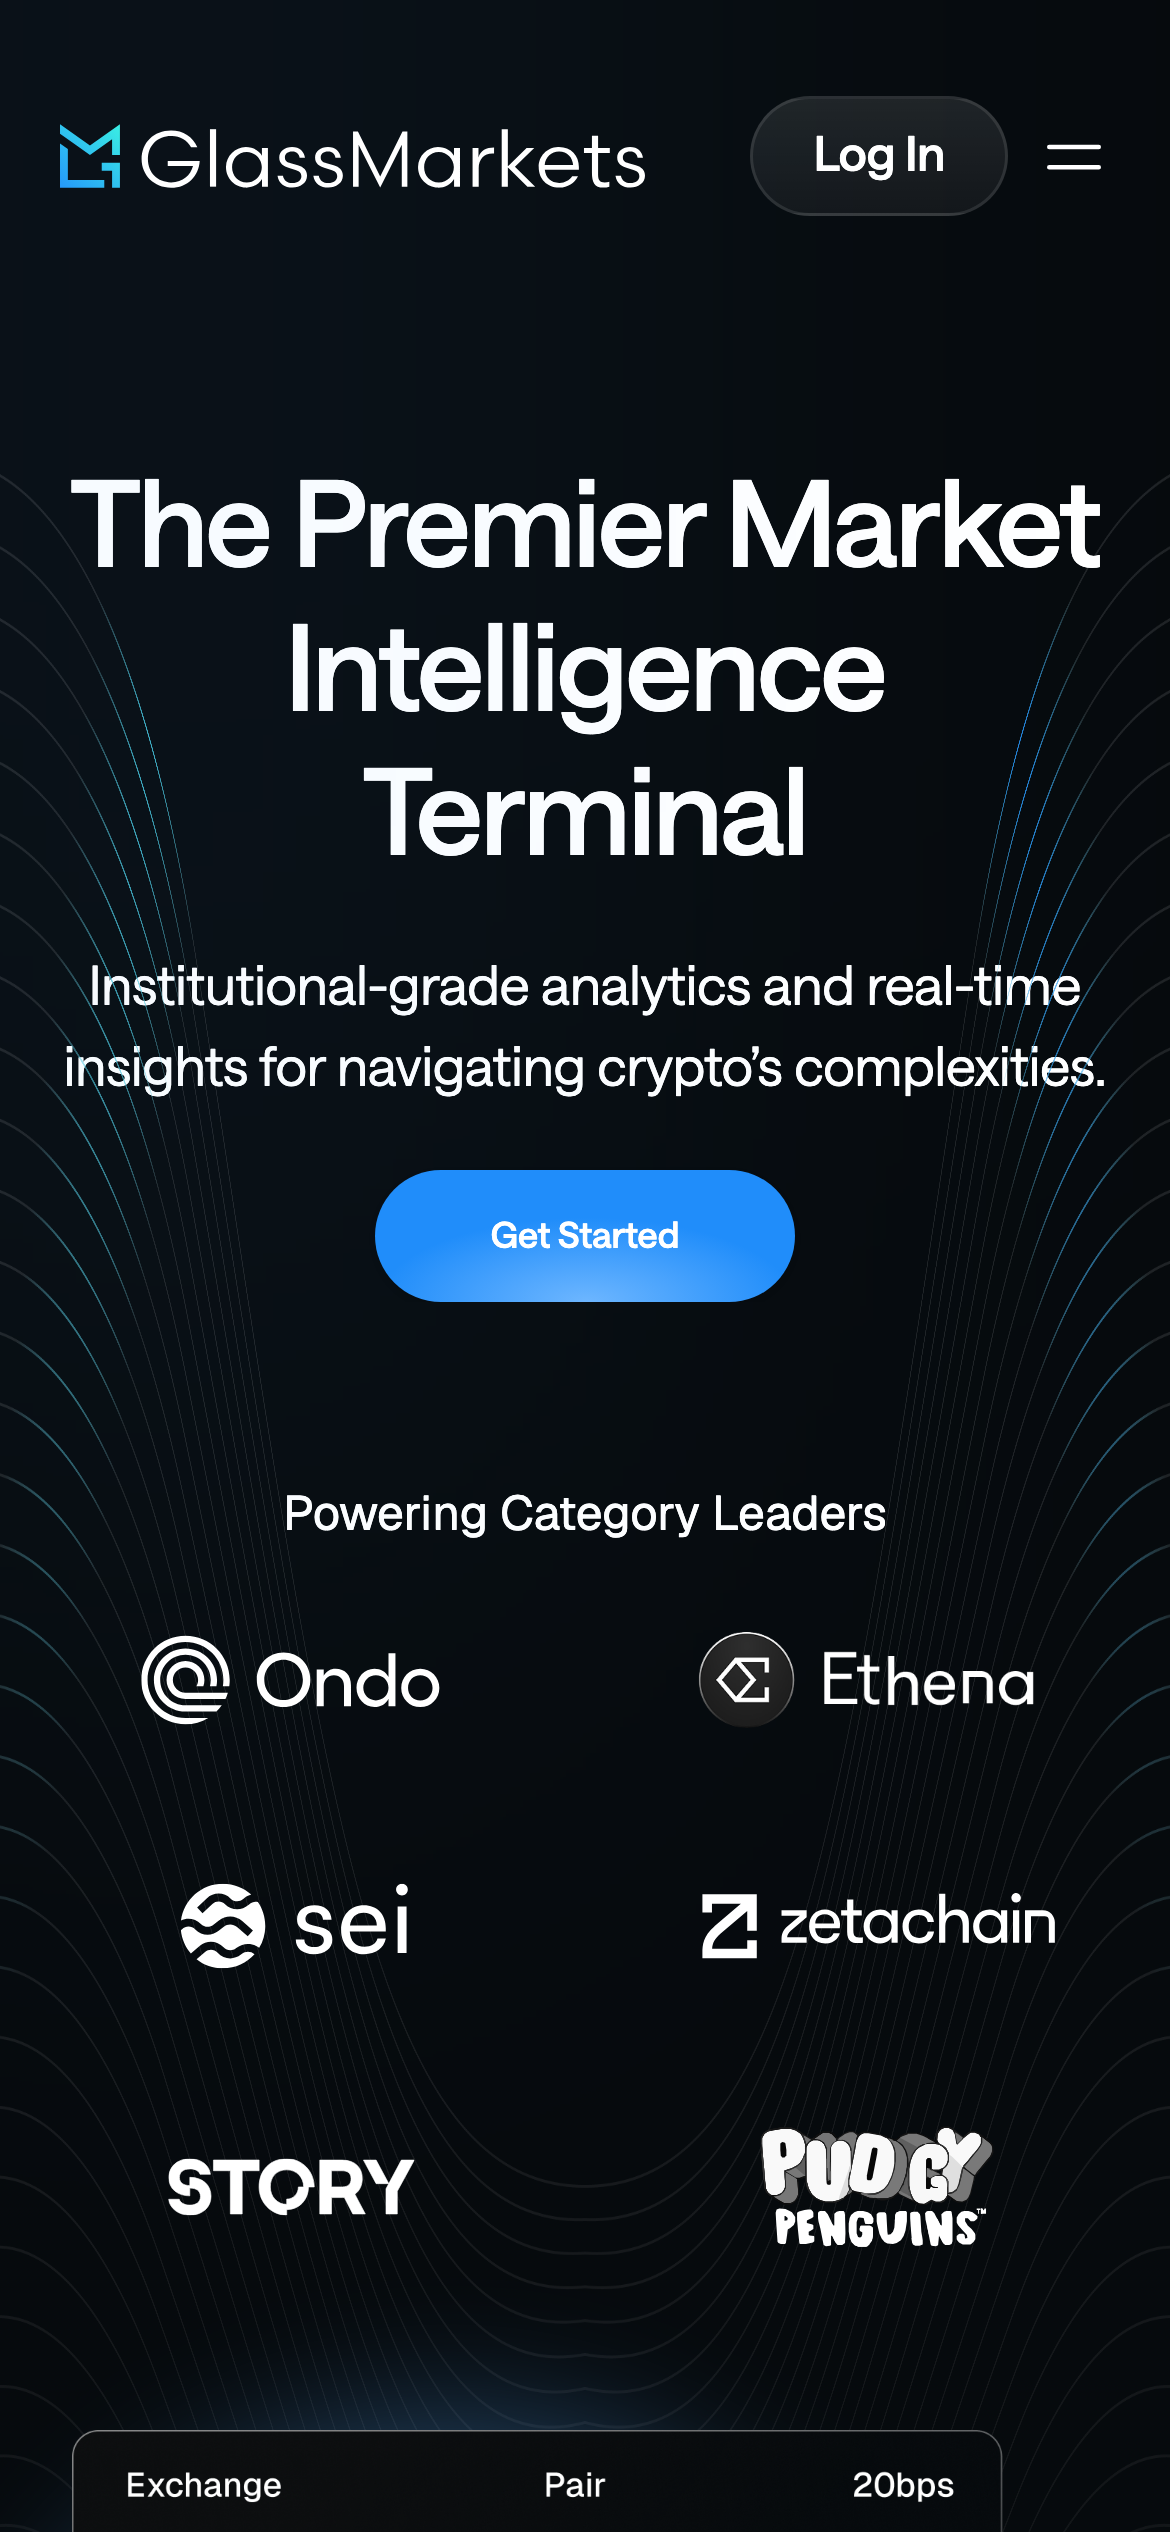
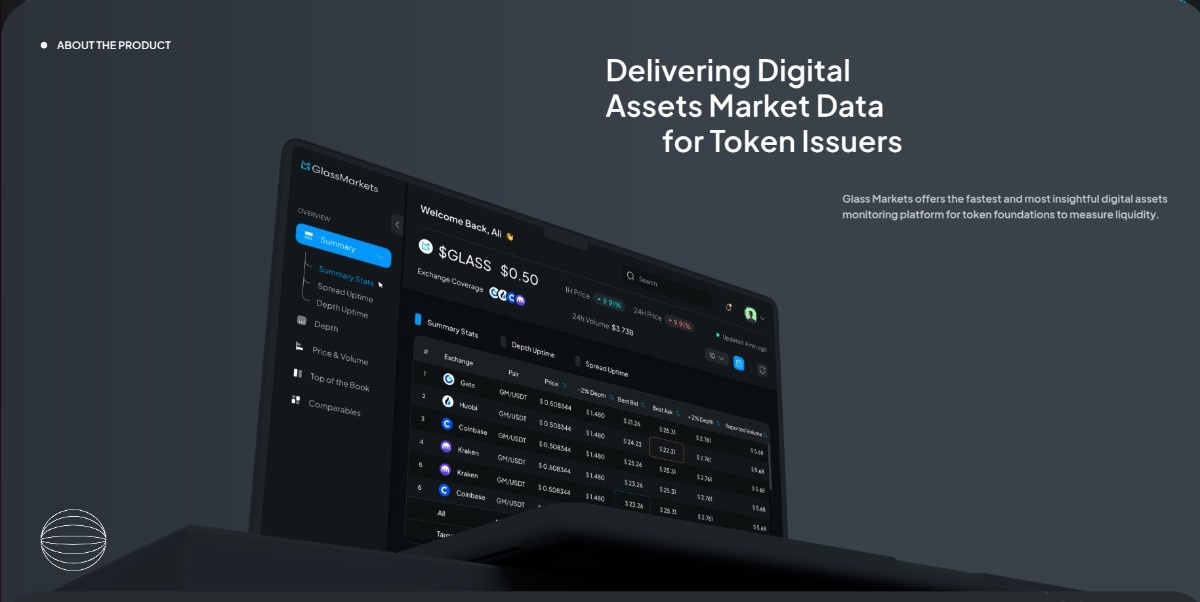
Barq built a landing page for Glass Markets alongside the engineering work in the terminal. The archived materials show how Glass Markets introduced the product to token issuers with a preview of the app.
What we built
Market data pipelines
Barq worked on the pipelines that collect market data, transform it and load it for use by the analytics platform.
Backend analytics and data API
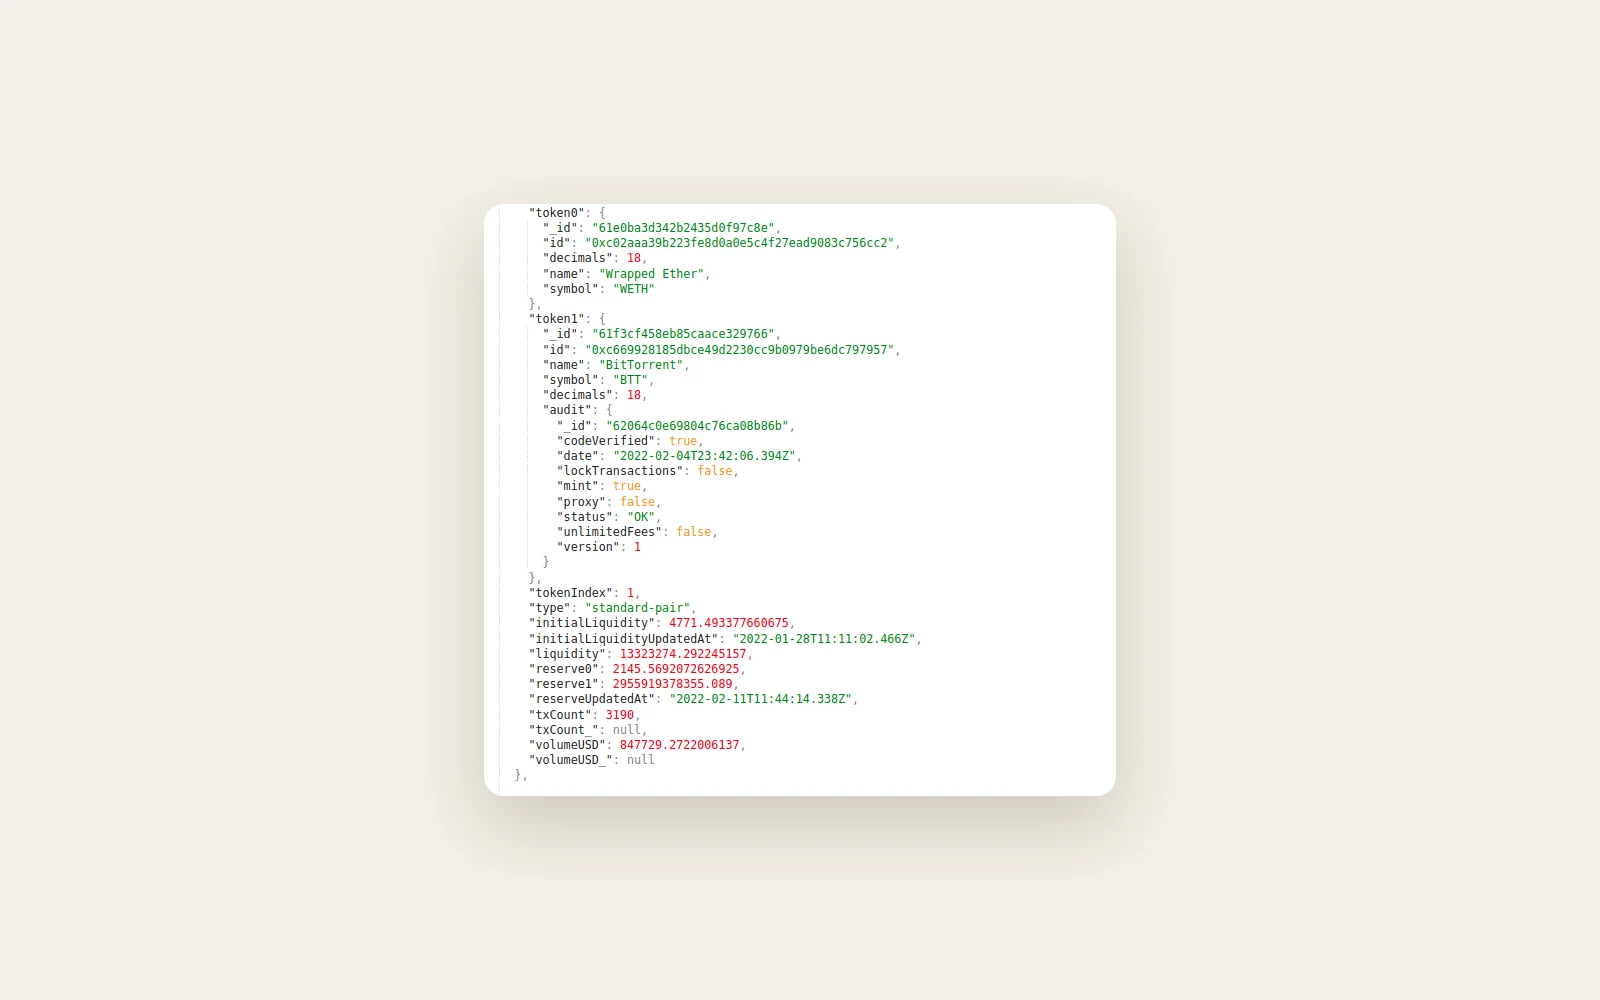
Barq added backend features to the existing analytics app. The archived API example shows a structured response with token identifiers and trading-pair data such as liquidity and volume.
Market data visualisations
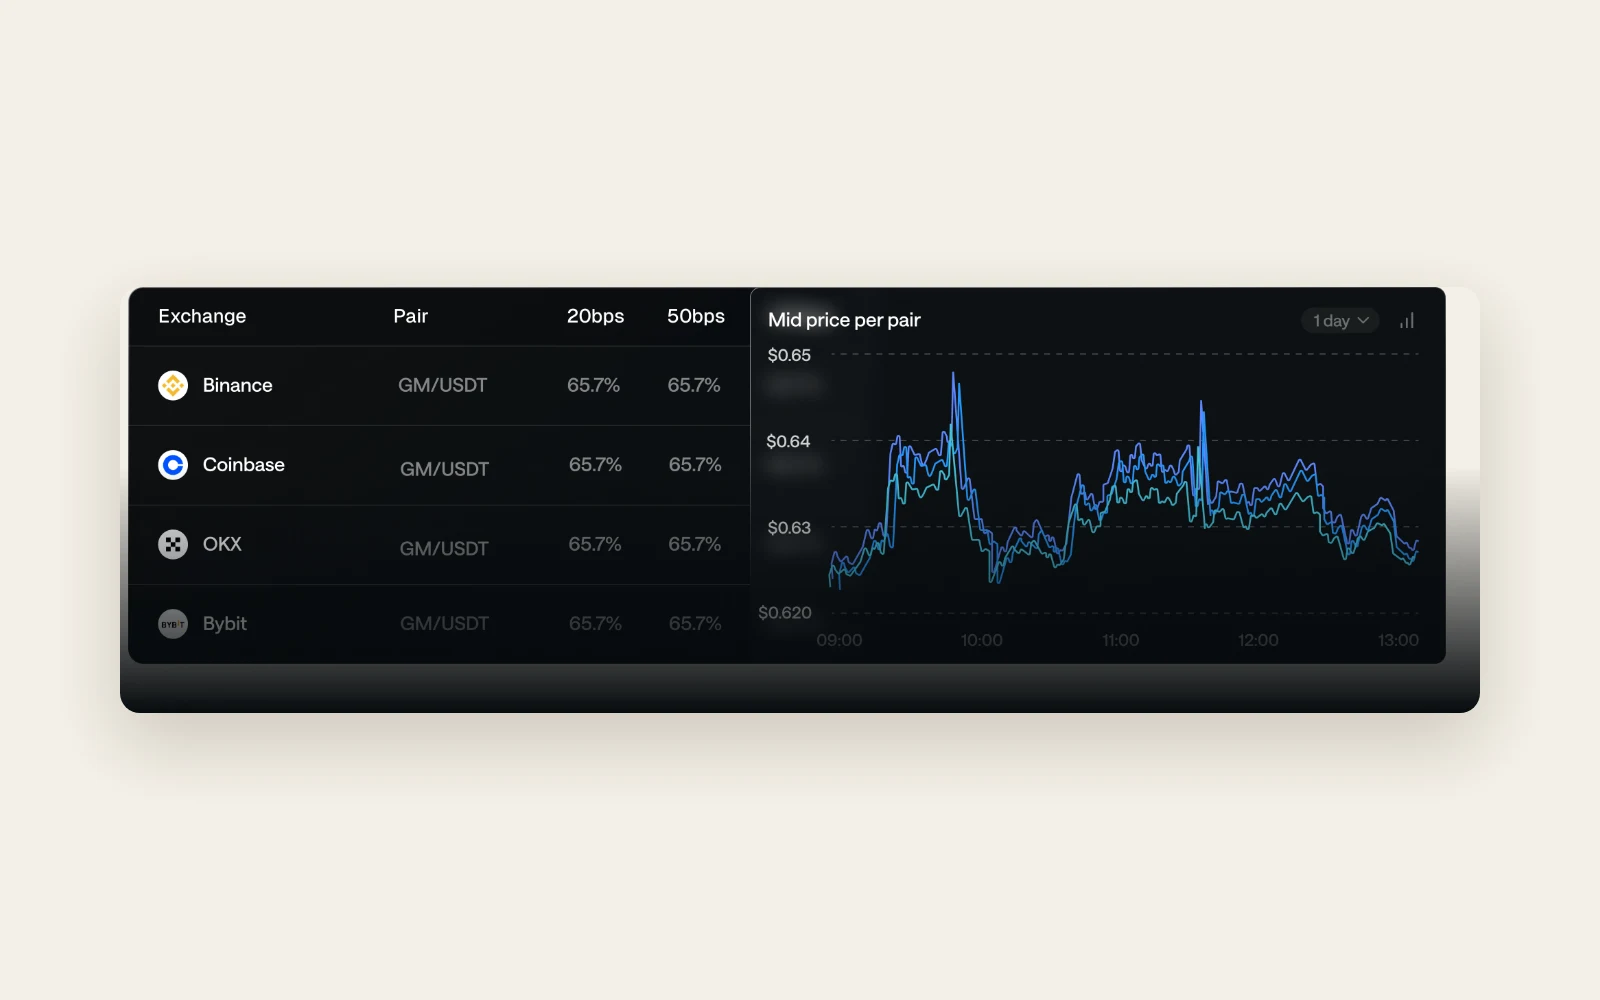
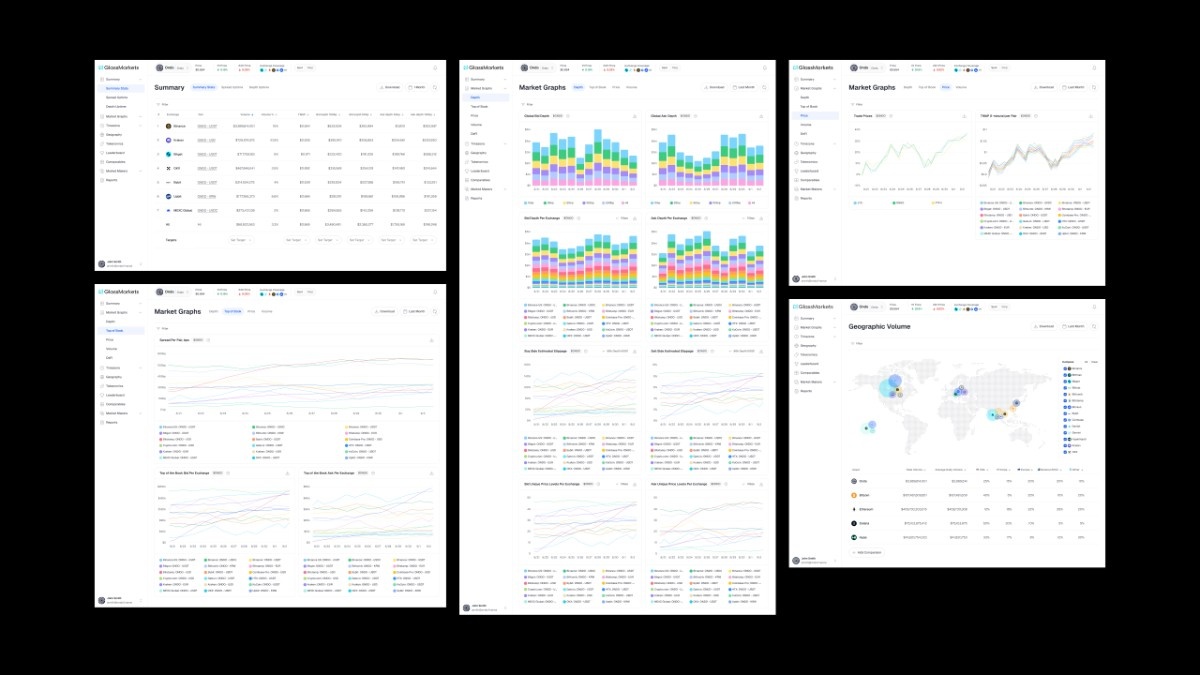
Barq added charts and other visualisations to the terminal. Archived product screens show stacked charts, time-series views and tables for inspecting exchange activity.
Glass Markets landing page
The landing page gave prospective customers an introduction to the terminal outside the analytics app.
Results
- The in-house team was able to share backend and data pipeline work with Barq while continuing to develop the platform.
- The existing terminal gained backend analytics features and additional market data visualisations.
- Glass Markets received a landing page introducing the product to prospective customers.
Under the hood
The recorded backend stack includes Python, Django and ASGI. The work covered both the pipelines that prepared market data and the backend components that made it available to the app.
Tech stack
- Python
- Django
- ASGI