Overview
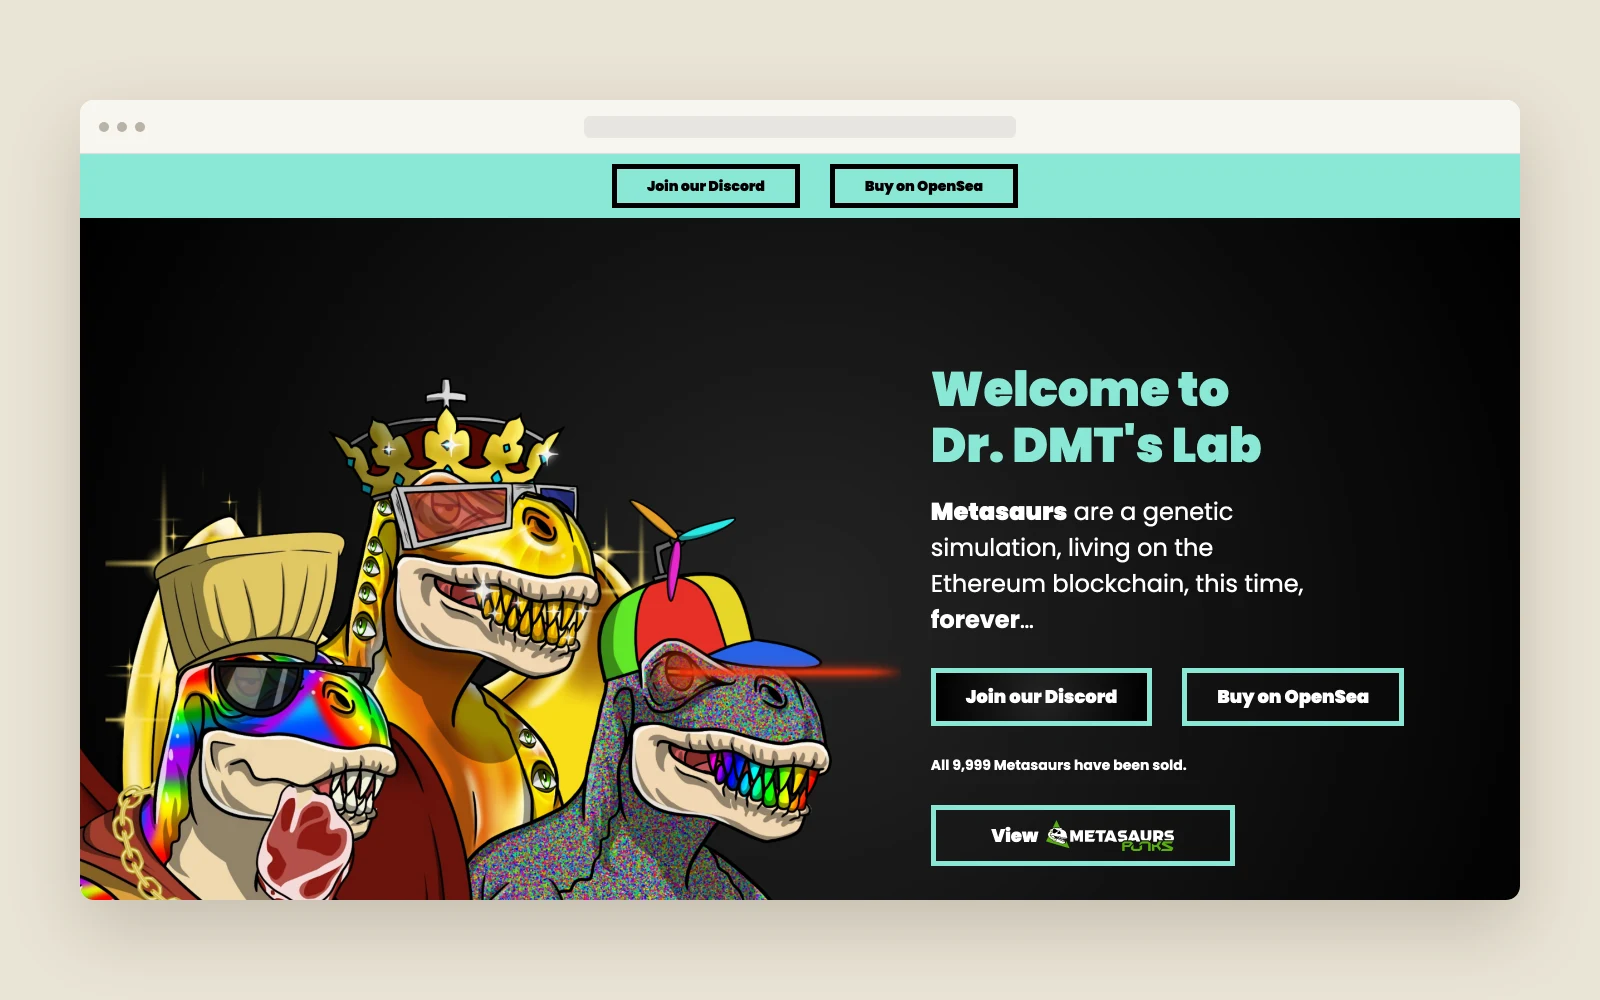
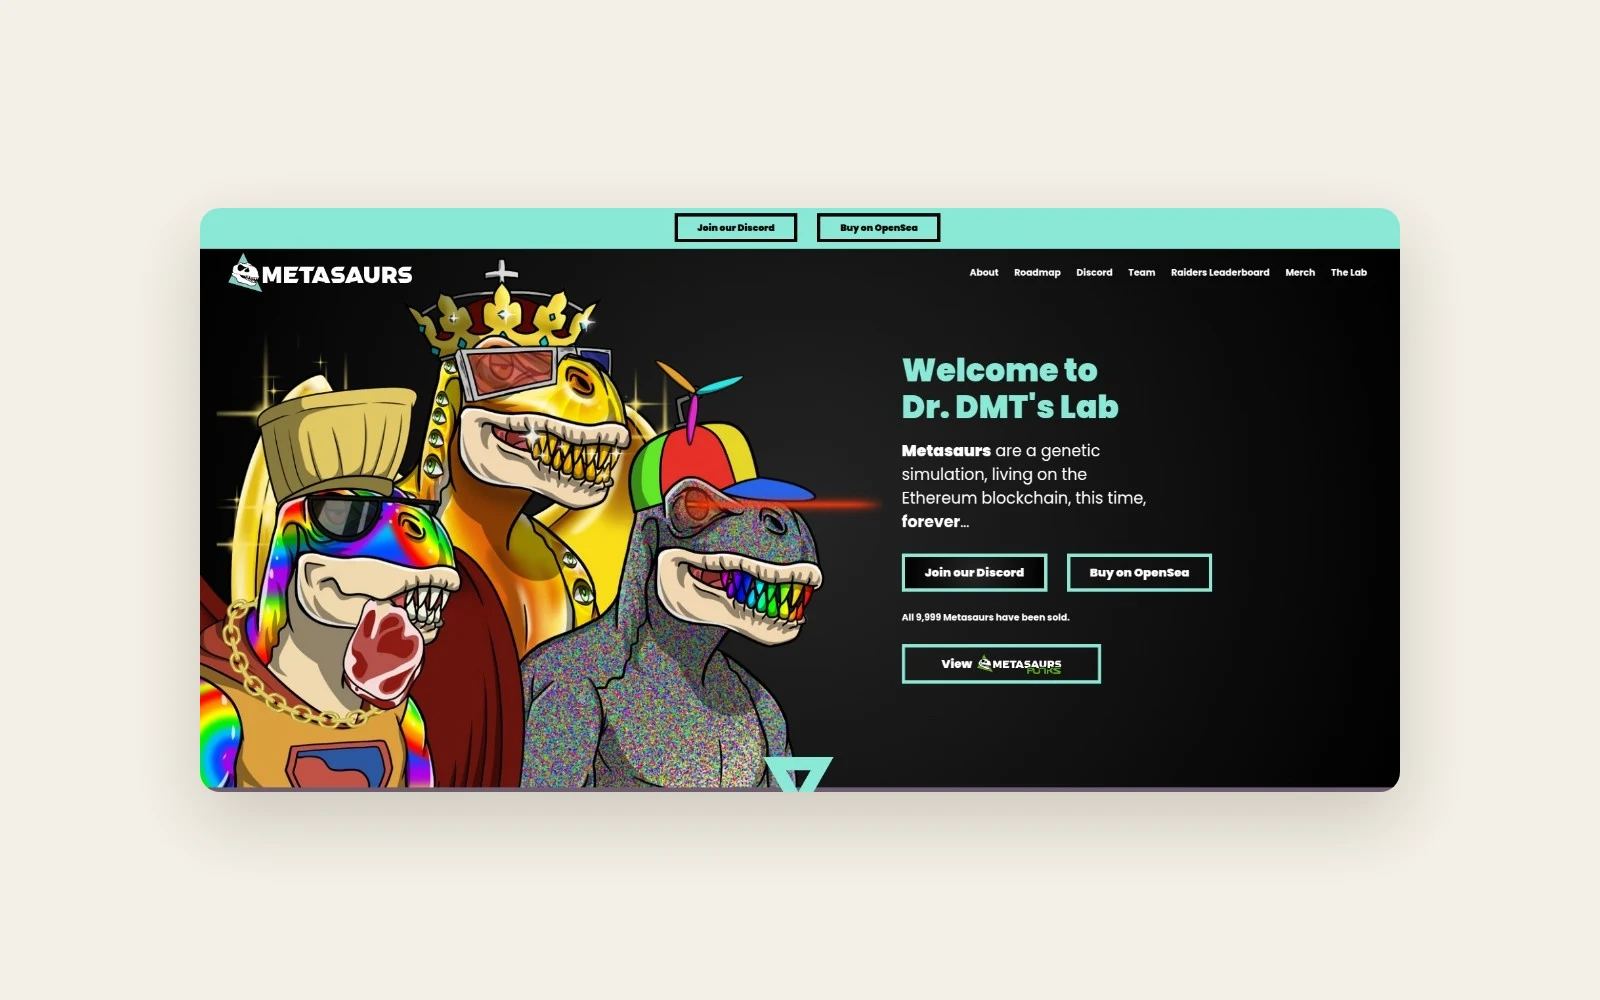
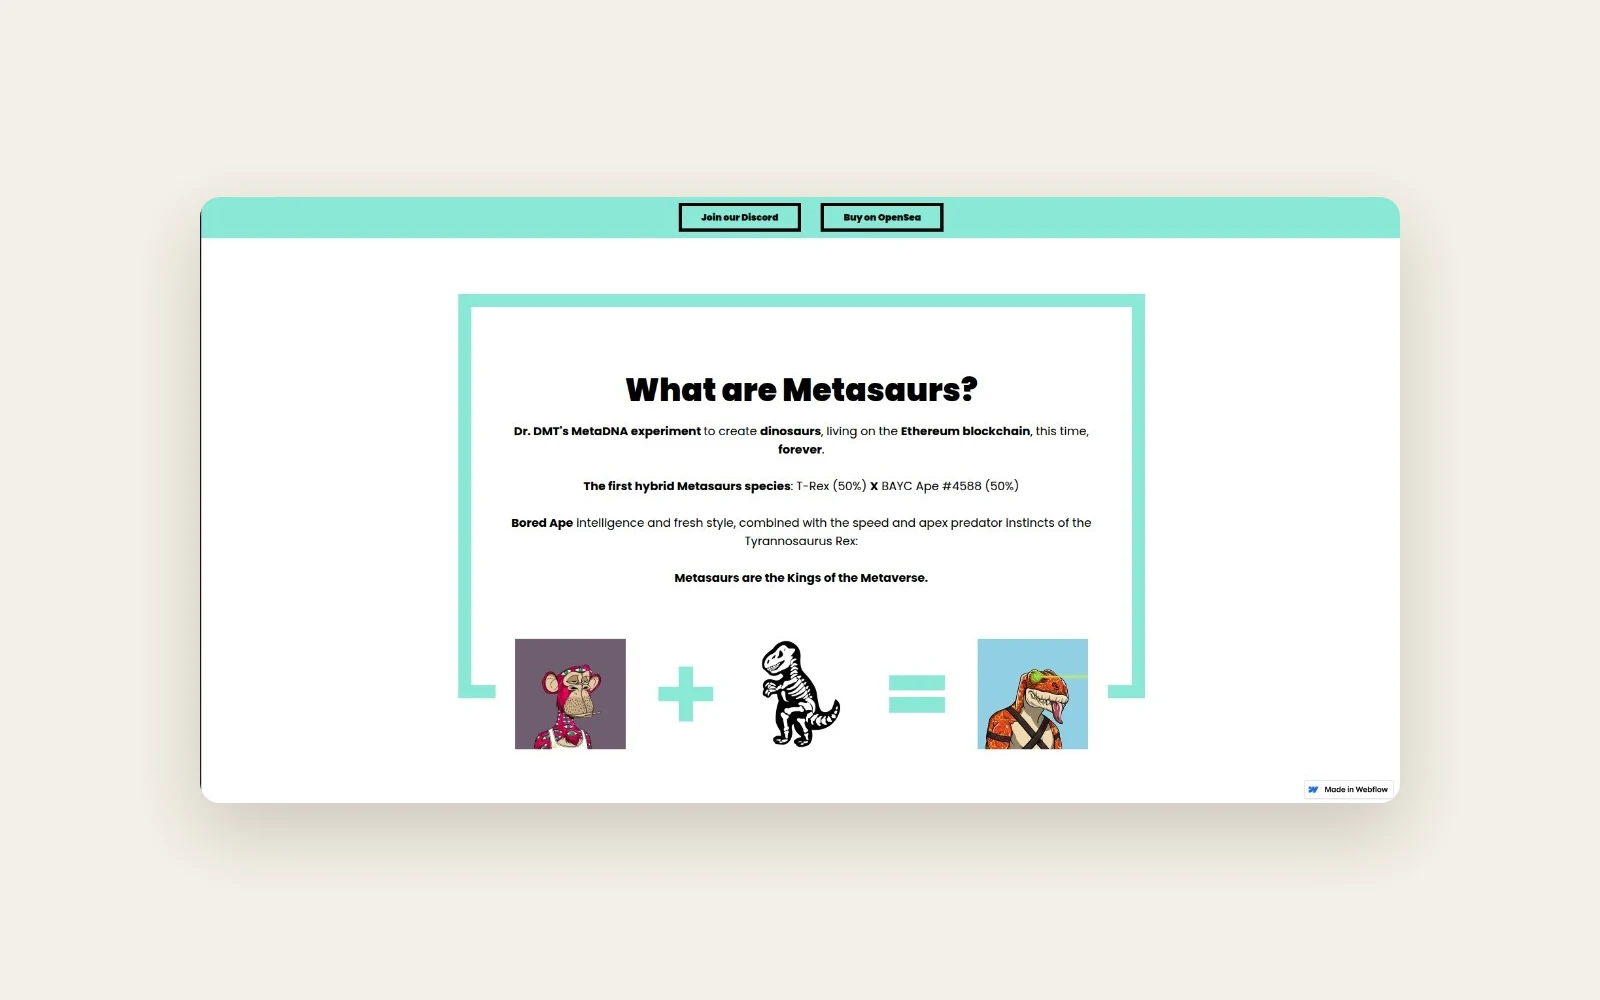
Metasaurs is an Ethereum-based collection of illustrated dinosaur characters. Its team ran social campaigns for the community and wanted a way to see the posts that qualified and how people engaged with them.
Barq collected and analysed social data, primarily from Twitter (now X), and built dashboards for individual campaigns. The Raiders Leaderboard turned posts that used selected hashtags into a ranked view of campaign activity.
The problem
Metasaurs needed a consistent way to find the posts relevant to each campaign. Once the team had found those posts, it needed to compare them using several signals, including how people engaged with a post and when it was published. The Raiders campaign also needed a place where someone could look up a specific account or see activity over a chosen date range.
The challenge
Define which posts qualified
Metasaurs set criteria for each campaign. For the Raiders Leaderboard, selected hashtags defined which Twitter posts to collect and analyse.
Turn post activity into standings
A single post could have likes, replies, reposts and quote posts. The ranking needed to consider those signals and the time of the post, then present the resulting points in a table that could be filtered by date or account.
How we approached it
Use the campaign criteria to guide data collection
Barq worked campaign by campaign. The posts Metasaurs wanted to analyse determined what Barq collected and what each dashboard showed.
Calculate rankings from the extracted data
For Raiders, Barq took the details from matching Twitter posts and wrote ranking logic that used the recorded activity and posting time. The resulting data was sent to the dashboard frontend.
Give viewers a way to narrow the leaderboard
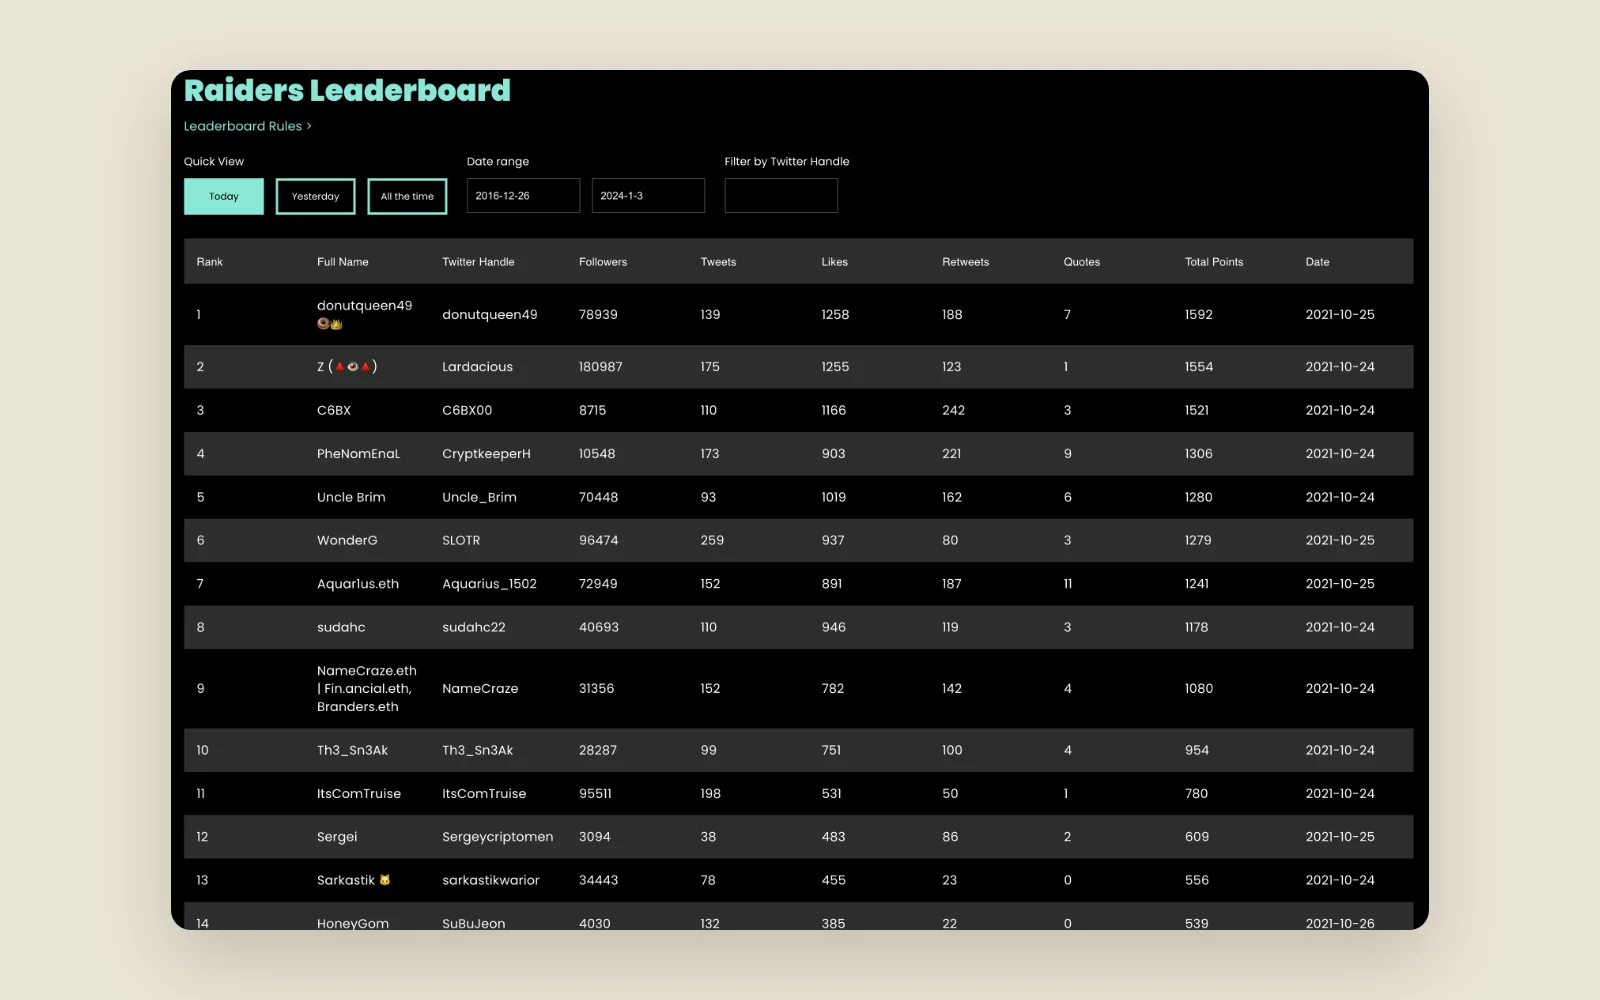
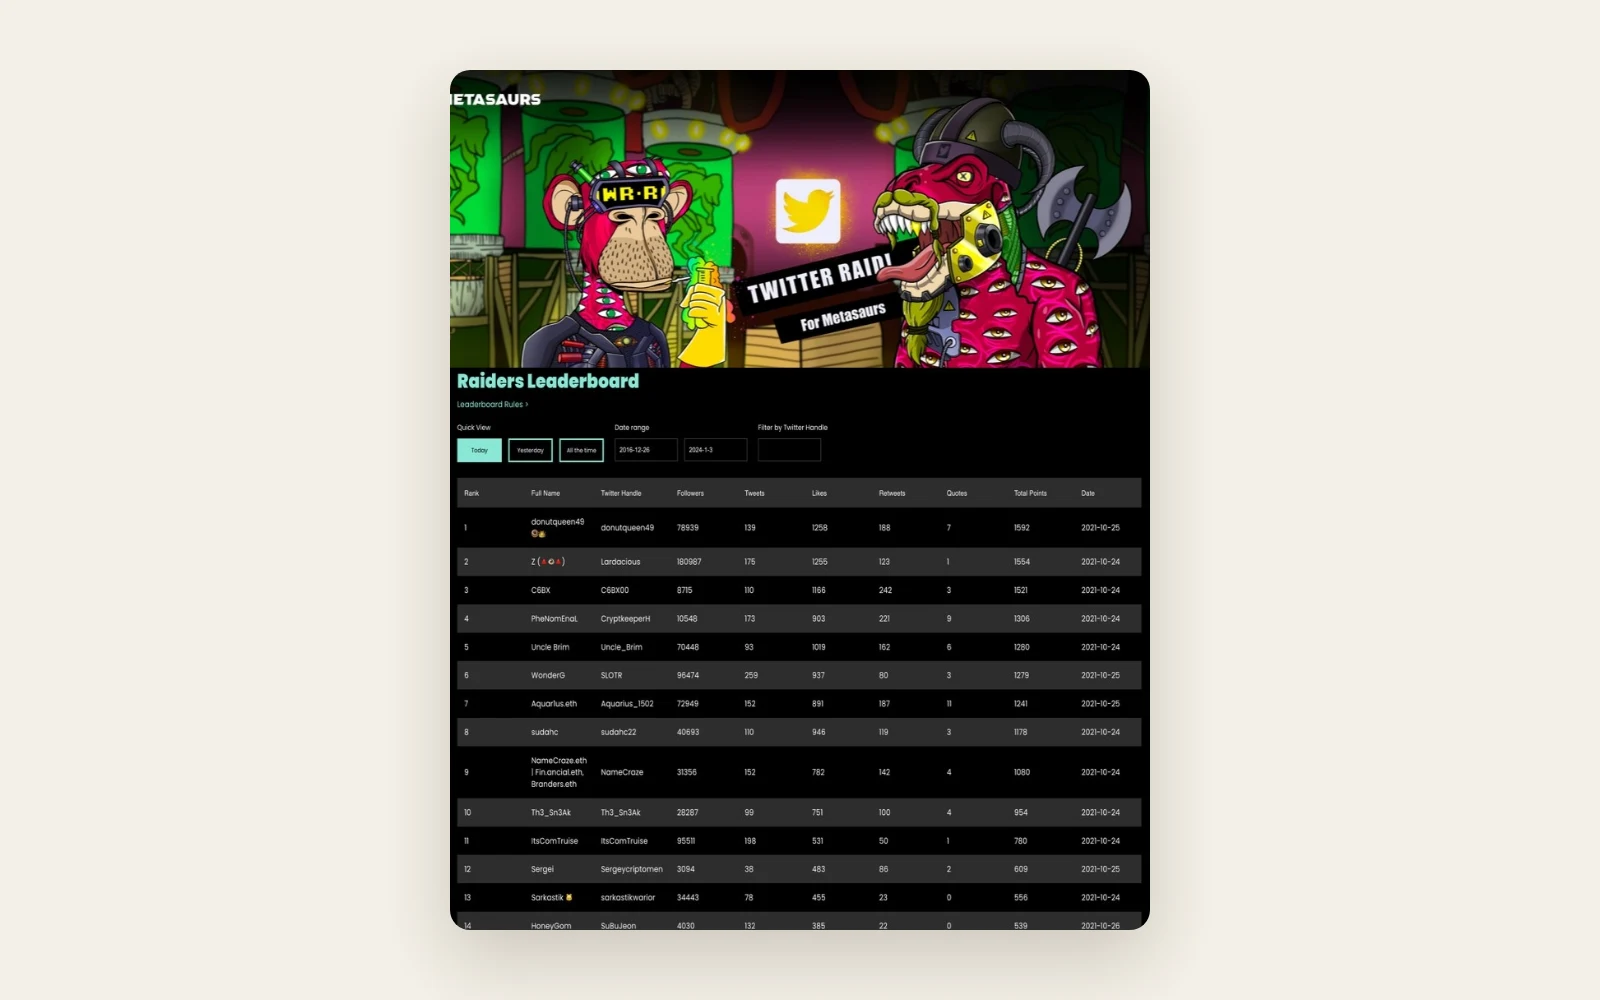
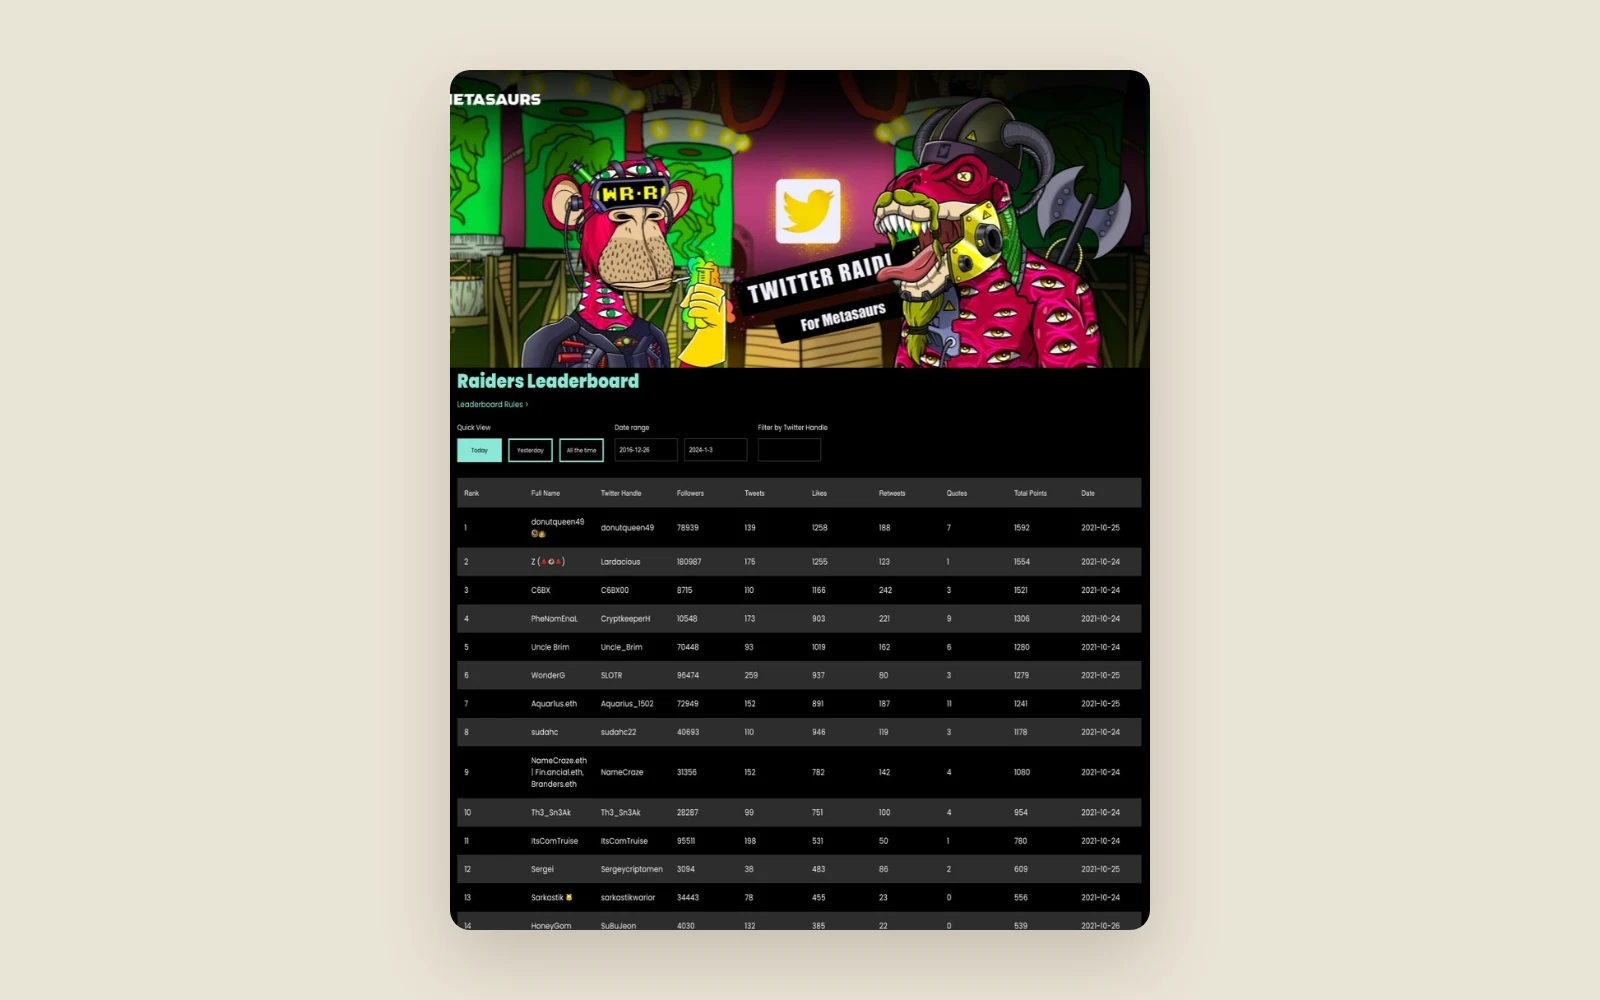
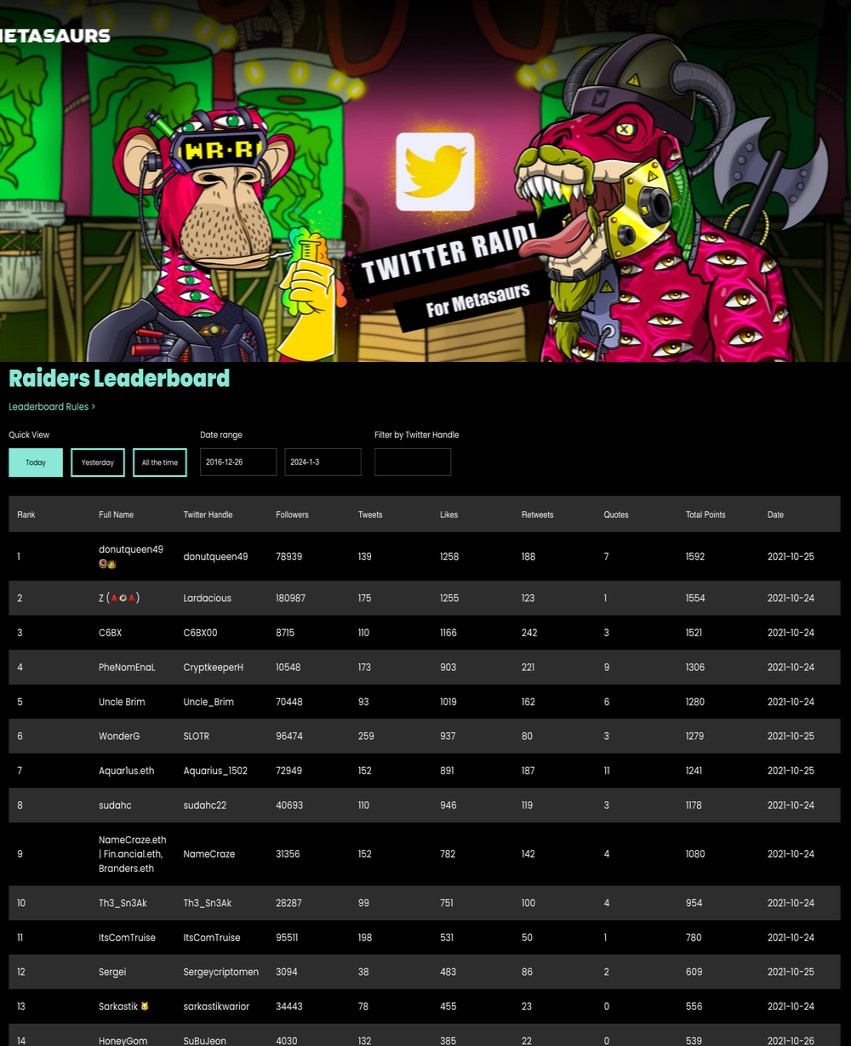
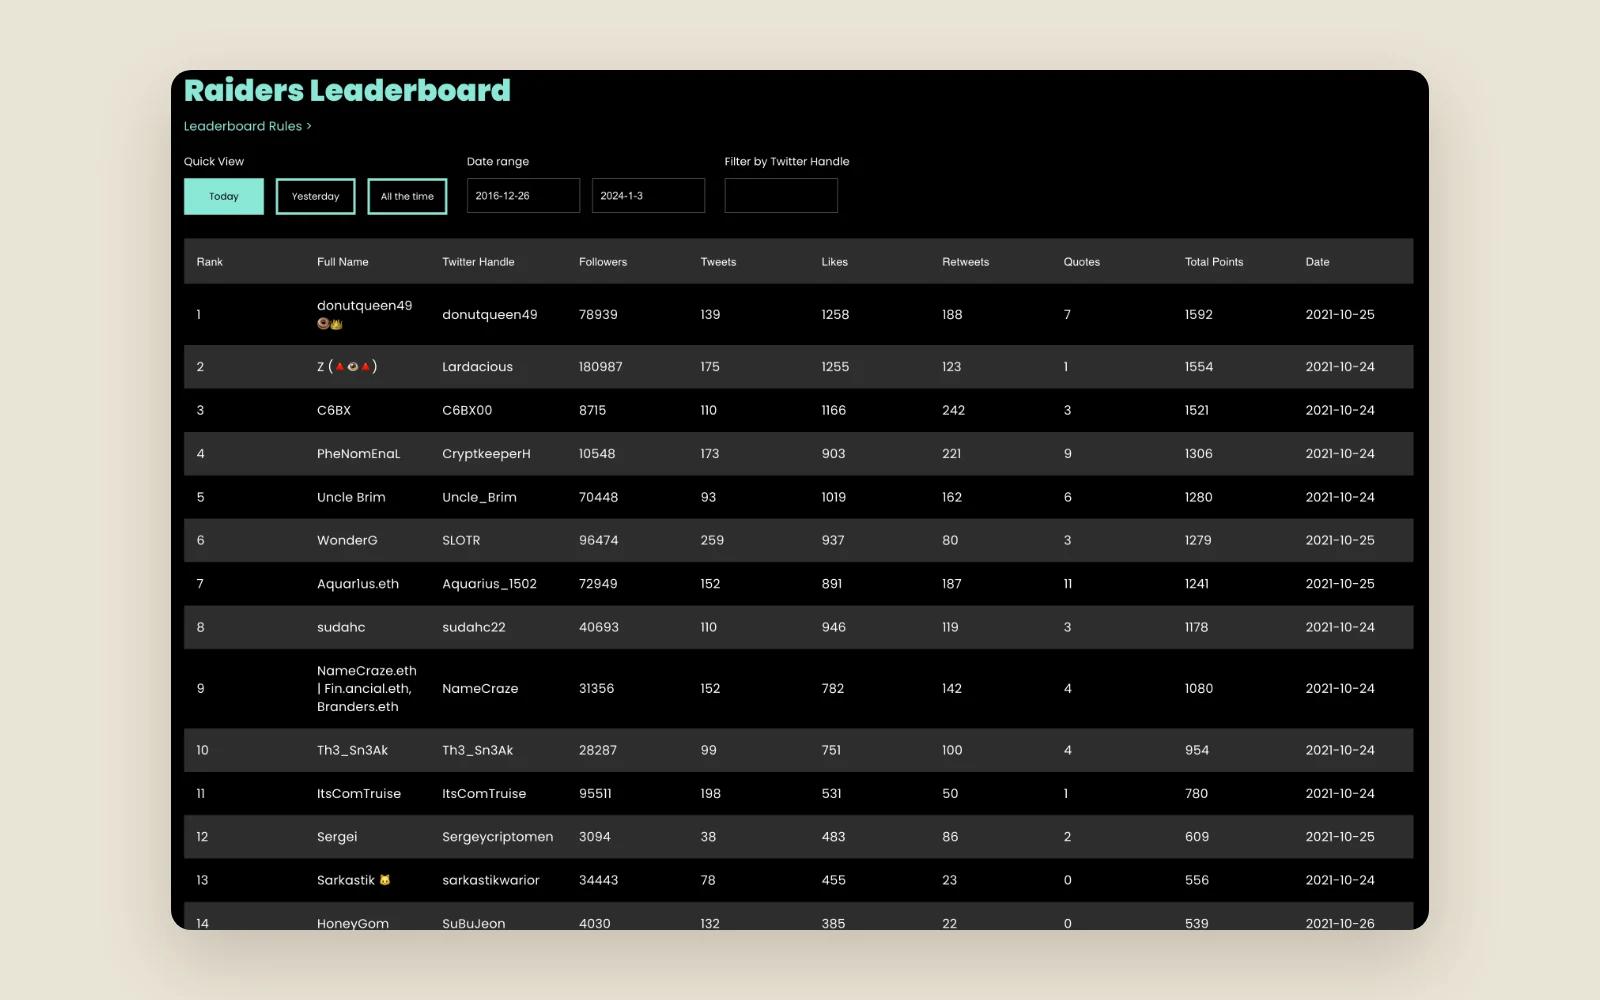
Barq built the leaderboard around a ranked table. Viewers could choose a date range, switch to one of the quick time views or search for a specific Twitter handle.
What we built
Hashtag-based collection
The Raiders collection process pulled details and engagement data from posts using the campaign's selected hashtags.
Rules-based ranking
The ranking used likes, replies, reposts, quote posts and posting time. The leaderboard displayed ranks and total points alongside activity counts.
Date and account filters
Viewers could use quick views for today, yesterday or all time, enter a date range or filter by Twitter handle.
Campaign dashboards
Barq consolidated posts and engagement data into dashboards for individual campaigns. The Raiders view included a ranked account table with post and engagement totals.
Results
- The Metasaurs team could review collected posts and their activity together for each campaign.
- The Raiders Leaderboard presented campaign activity as ranked accounts with points and engagement counts.
- Viewers could narrow the Raiders standings to a specific time period or look up an individual account.
Under the hood
The recorded stack includes Python, Django, Scrapy and NumPy. The extract, transform and load workflow started with details from individual posts. The dashboard presented those details as account-level totals and ranks.
Tech stack
- Python
- Django
- ETL
- Scrapy
- NumPy